Multiple Choice
Figure 8-2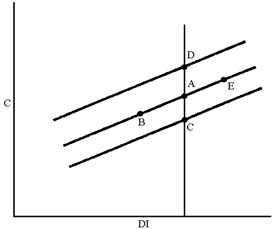
In Figure 8-2, which of the following moves can be explained by a decrease in disposable income?
A) E to B
B) A to C
C) A to D
D) B to E
Correct Answer:
Verified
Related Questions
Q101: A movement upward along the consumption function
Q104: Figure 8-1 Q105: To predict the effects of a tax
![]()
Unlock this Answer For Free Now!
View this answer and more for free by performing one of the following actions

Scan the QR code to install the App and get 2 free unlocks

Unlock quizzes for free by uploading documents