Aggregate demand and supply curves have been widely used to analyze the performance of the macroeconomy. Figure 5-3 shows four diagrams that represent different changes in the macroeconomy. Choose the diagram that best represents the situations described in the following questions. Figure 5-3 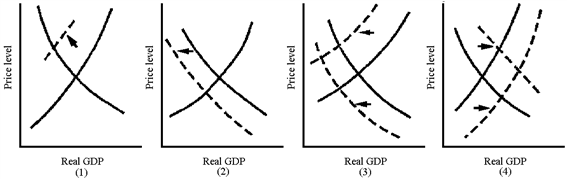
Which graph in Figure 5-3 best represents the favorable macroeconomy of the late 1990s?
A) 1
B) 2
C) 3
D) 4
Correct Answer:
Verified
Q181: To fight inflation, the government may
A)decrease aggregate
Q187: To fight recession, the government may
A)decrease aggregate
Q187: Aggregate demand and supply curves have been
Q189: Aggregate demand and supply curves have been
Unlock this Answer For Free Now!
View this answer and more for free by performing one of the following actions

Scan the QR code to install the App and get 2 free unlocks

Unlock quizzes for free by uploading documents