Figure 53-1 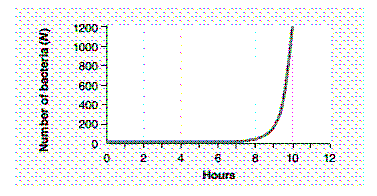 The equation that would best describe the curve in the accompanying figure is:
A) dN / dt = r .
B) dN / dt = N .
C) dN / dt = rN .
D) dN / dt = rN + I − e .
E) dN / dt = rN ( K − N ) .
Correct Answer:
Verified
Q3: When r = −0.00057, the population size:
A)
Q9: At zero population growth:
A) b = d.
B)
Q9: What term refers to the average rate
Q10: The best definition of population density is
Q12: Biologists in which of the following applied
Q13: When r = 0.00001, the population size:
A)
Q14: Natural selection acts most directly on:
A) populations.
B)
Q14: Which of the following series correctly represents
Q17: Which of the following consists of organisms,
Q20: Clumped dispersion is often influenced by:
A) the
Unlock this Answer For Free Now!
View this answer and more for free by performing one of the following actions

Scan the QR code to install the App and get 2 free unlocks

Unlock quizzes for free by uploading documents