Figure 53-1 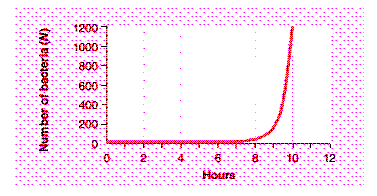 The graph in the accompanying figure would best be described as:
A) being characteristic of exponential growth.
B) being characteristic of arithmetic growth.
C) an S-shaped curve.
D) a J-shaped curve.
E) being a J-shaped curve characteristic of exponential growth.
Correct Answer:
Verified
Q2: The organisms associated with patches of floating
Q3: Which of the following organisms would have
Q4: Which of the following relationships is incorrectly
Q5: _ is the least frequent of the
Q7: What would be the growth rate (
Q9: What term refers to the average rate
Q9: At zero population growth:
A) b = d.
B)
Q12: Biologists in which of the following applied
Q13: When r = 0.00001, the population size:
A)
Q14: Natural selection acts most directly on:
A) populations.
B)
Unlock this Answer For Free Now!
View this answer and more for free by performing one of the following actions

Scan the QR code to install the App and get 2 free unlocks

Unlock quizzes for free by uploading documents