Multiple Choice
Figure 53-1 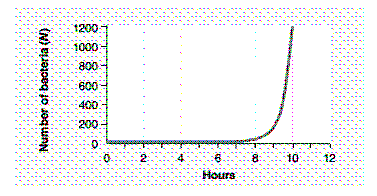
The graph in the accompanying figure would best be described as:
A) being characteristic of exponential growth.
B) being characteristic of arithmetic growth.
C) an S-shaped curve.
D) a J-shaped curve.
E) being a J-shaped curve characteristic of exponential growth.
Correct Answer:
Verified
Related Questions
Q11: Which of the following is a correct
Q12: What term refers to the average rate
Q13: When r = 0.00001, the population size:
A)
Q14: Natural selection acts most directly on:
A) populations.
B)
Q15: Which of the following is NOT a
Unlock this Answer For Free Now!
View this answer and more for free by performing one of the following actions

Scan the QR code to install the App and get 2 free unlocks

Unlock quizzes for free by uploading documents