Multiple Choice
Table 7-6

-Refer to Table 7-6.You are selling extra tickets to the Midwest Regional Sweet 16 game in the men's NCAA basketball tournament.The table shows the willingness to pay of the four potential buyers in the market for a ticket to the game.Which of the following graphs represents the market demand curve?
A) 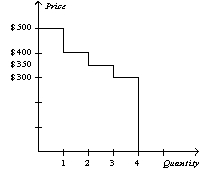
B) 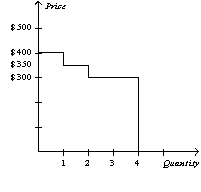
C) 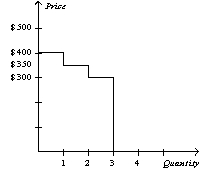
D) 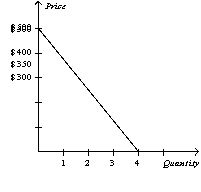
Correct Answer:
Verified
Related Questions
Q33: Suppose Katie,Kendra,and Kristen each purchase a particular
Q35: Suppose Lauren,Leslie and Lydia all purchase bulletin
Q58: Table 7-5
For each of three potential buyers
Q59: Table 7-5
For each of three potential buyers
Q60: Table 7-5
For each of three potential buyers
Q61: Kelly is willing to pay $68 for

