Exhibit 10-3 Aggregate supply and demand curves 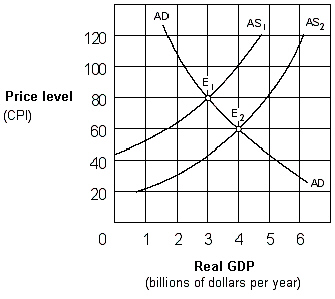 The shift from AS1 to AS2 in Exhibit 10-3 could be caused by a(n) :
A) sudden increase in the price of oil.
B) increase in input prices for most firms.
C) increase in workers' wages.
D) all of these.
Correct Answer:
Verified
Q83: _ inflation can be explained by an
Q133: _ inflation can be explained by an
Q133: When the economy is experiencing high inflation
Q135: Demand-pull inflation is caused by:
A)an increase in
Q136: Demand-pull inflation is associated with a(n):
A) decrease
Q137: Cost-push inflation occurs when the:
A) aggregate demand
Q139: Exhibit 10-4 Aggregate supply and demand curves
Q141: Exhibit 10-6 Aggregate supply curve 
Q142: Exhibit 10-7 Aggregate supply and demand curves
Q143: Exhibit 10-6 Aggregate supply curve
Unlock this Answer For Free Now!
View this answer and more for free by performing one of the following actions

Scan the QR code to install the App and get 2 free unlocks

Unlock quizzes for free by uploading documents