Exhibit 10-3 Aggregate supply and demand curves 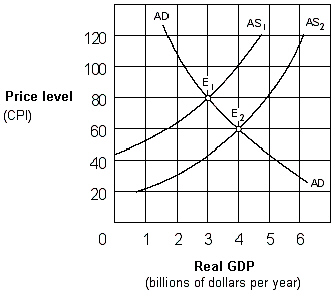 A shift in the aggregate supply curve in Exhibit 10-3 from AS1 to AS2 would be caused by a(n) :
A) increase in consumer spending.
B) increase in input prices.
C) decrease in input prices.
D) decrease in real output.
Correct Answer:
Verified
Q83: _ inflation can be explained by an
Q123: Stagflation is a period of time when
Q128: Exhibit 10-4 Aggregate supply and demand curves
Q129: Exhibit 10-2 Aggregate supply and demand curves
Q130: When OPEC caused the price of oil
Q131: When the aggregate demand curve shifts to
Q133: _ inflation can be explained by an
Q135: Demand-pull inflation is caused by:
A)an increase in
Q136: Demand-pull inflation is associated with a(n):
A) decrease
Q137: Cost-push inflation occurs when the:
A) aggregate demand
Unlock this Answer For Free Now!
View this answer and more for free by performing one of the following actions

Scan the QR code to install the App and get 2 free unlocks

Unlock quizzes for free by uploading documents