Exhibit 3A-2 Comparison of Market Efficiency and Deadweight Loss 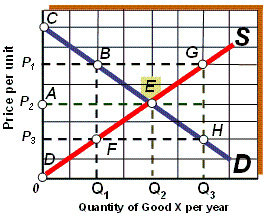 As shown in Exhibit 3A-2, if the quantity supplied of good X per year is Q1, the result is a deadweight loss represented by area:
A) BEG.
B) CBEFD.
C) EGH.
D) BEF.
Correct Answer:
Verified
Q39: Exhibit 3A-1 Comparison of Market Efficiency and
Q41: Exhibit 3A-2 Comparison of Market Efficiency and
Q42: Exhibit 3A-1 Comparison of Market Efficiency and
Q45: Exhibit 3A-2 Comparison of Market Efficiency and
Q46: Exhibit 3A-2 Comparison of Market Efficiency and
Q47: Exhibit 3A-1 Comparison of Market Efficiency and
Q48: Exhibit 3A-1 Comparison of Market Efficiency and
Q54: Deadweight loss is not the result of:
A)
Q371: Deadweight loss is the result of:
A) disequilibrium.
B)
Q409: The points along the demand curve represent
Unlock this Answer For Free Now!
View this answer and more for free by performing one of the following actions

Scan the QR code to install the App and get 2 free unlocks

Unlock quizzes for free by uploading documents