Aptitude Test Scores Two random samples of 40 students were drawn independently from two populations of students. Assume their aptitude tests are normally distributed (total points = 100). The following statistics regarding their scores in an aptitude test were obtained: 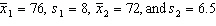 . {Aptitude Test Scores Narrative} Estimate with 95% confidence the difference between the two population means.
Correct Answer:
Verified
View Answer
Unlock this answer now
Get Access to more Verified Answers free of charge
Q62: Undergraduates' Test Scores 35 undergraduate students who
Q63: In a matched pairs experiment the parameter
Q63: Promotional Campaigns The general manager of a
Q64: The service manager of a car dealer
Q68: If you are testing to see if
Q68: Additives A food processor wants to compare
Q69: Additives A food processor wants to compare
Q70: In testing the hypothesis Q71: Starting Salary In testing the hypotheses Q72: Starting Salary In testing the hypotheses ![]()
Unlock this Answer For Free Now!
View this answer and more for free by performing one of the following actions

Scan the QR code to install the App and get 2 free unlocks

Unlock quizzes for free by uploading documents