The following diagram contains information on cost and revenue curves facing a regulated monopoly.
FIGURE 9-3
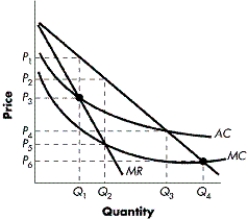
-Refer to Figure 9-3. Where would the socially efficient level of output occur?
A) where price equals average total cost at Q3
B) where marginal revenue equals marginal cost at Q2
C) where price equals marginal cost at Q4
D) where price equals marginal revenue at Q1
Correct Answer:
Verified
Q68: Which of the following does NOT describe
Q69: Which of the following best describes a
Q70: The following diagram contains information on cost
Q71: At a given output level, when can
Q72: The following diagram contains information on cost
Q74: The following diagram contains information on cost
Q75: Which of the following is a major
Q76: What will the use of average-cost pricing
Q77: If the average total cost curve is
Q78: Do monopolists need to worry about producing
Unlock this Answer For Free Now!
View this answer and more for free by performing one of the following actions

Scan the QR code to install the App and get 2 free unlocks

Unlock quizzes for free by uploading documents