This figure shows the long-run average total cost curve for a firm that produces basketballs, along with four short-run average total cost curves. Each of the short-run average total cost curves corresponds to a different plant size. SRATC₁ corresponds to Plant size 1, SRATC₂ corresponds to Plant size 2, and so forth.
FIGURE 7-6
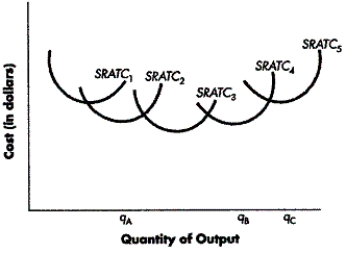
-Refer to Figure 7-6. Which plant size is optimal for the firm to produce qC units of output each week?
A) Plant 2
B) Plant 3
C) Plant 4
D) Plant 5
Correct Answer:
Verified
Q96: Typically, what is the shape of the
Q97: FIGURE 7-4 Q98: If average fixed cost and average variable Q99: A firm is producing 200 units of
![]()
Unlock this Answer For Free Now!
View this answer and more for free by performing one of the following actions

Scan the QR code to install the App and get 2 free unlocks

Unlock quizzes for free by uploading documents