This figure shows the long-run average total cost curve for a firm that produces basketballs, along with four short-run average total cost curves. Each of the short-run average total cost curves corresponds to a different plant size. SRATC₁ corresponds to Plant size 1, SRATC₂ corresponds to Plant size 2, and so forth.
FIGURE 7-6
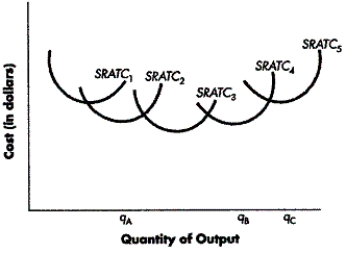
-Refer to Figure 7-6. Which plant size is optimal for the firm to produce qA units of output each week?
A) Plant 2
B) Plant 3
C) Plant 4
D) Plant 5
Correct Answer:
Verified
Q107: This figure shows the long-run average total
Q108: When there are diseconomies of scale in
Q109: What is the term for the lowest
Q110: Why does the short-run average total cost
Q111: Which of the following statements best describes
Q113: If total cost increases as output increases,
Q114: This figure shows the long-run average total
Q115: When there are economies of scale in
Q116: This figure shows the long-run average total
Q117: If the total cost of producing 10
Unlock this Answer For Free Now!
View this answer and more for free by performing one of the following actions

Scan the QR code to install the App and get 2 free unlocks

Unlock quizzes for free by uploading documents