Multiple Choice
FIGURE 5-3
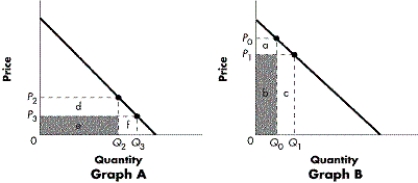
-Refer to Figure 5-3. Elasticity varies along a linear demand curve. What does Graph B represent?
A) the section of the curve where the curve is inelastic
B) the section of the curve where Ed is < 1
C) the section of the curve where, starting at P1, an increase in price will lead to an increase in total revenue
D) the section of the curve where the percentage change in quantity is larger than the percentage change in price
Correct Answer:
Verified
Related Questions

