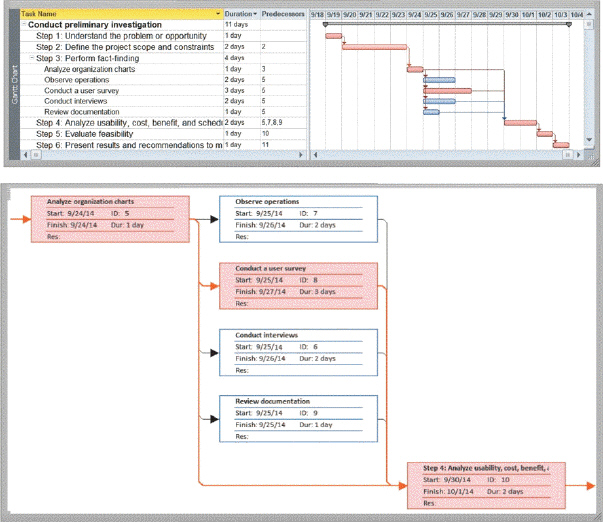
 As shown in the accompanying figure, a Gantt chart, developed by Henry Gantt, is which of the following?
A) diagram that graphically shows how actors interact with an information system
B) tool that graphically shows the flow of data in a system
C) bar chart that uses horizontal bars to show project phases or activities
D) table that lists a variety of conditions and the actions that correspond to them
Correct Answer:
Verified
Q3: In large companies, users write a formal
Q4: Which of the following measures how well
Q5: Which of the following identifies the product(s)
Q6: In sequence, traditional system development contains five
Q7: Which of the following is an advantage
Q9: Which of the following is a set
Q10: Which of the following phases consists of
Q11: Which of the following is any tangible
Q12: One member of the project team manages
Q13: Which of the following roles is responsible
Unlock this Answer For Free Now!
View this answer and more for free by performing one of the following actions

Scan the QR code to install the App and get 2 free unlocks

Unlock quizzes for free by uploading documents