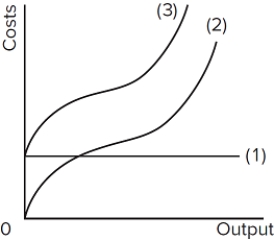
 In the diagram, curves 1, 2, and 3 represent
A) average fixed cost, average variable cost, and average total cost respectively.
B) total variable cost, total fixed cost, and total cost respectively.
C) total fixed cost, total variable cost, and total cost respectively.
D) marginal product, average variable cost, and average total cost respectively.
Correct Answer:
Verified
Q220: Q221: Q222: Q223: Which of the following is correct? Q224: Which of the following holds true? Q226: The vertical distance between a firm's ATC Q227: In the short run it is impossible Unlock this Answer For Free Now! View this answer and more for free by performing one of the following actions Scan the QR code to install the App and get 2 free unlocks Unlock quizzes for free by uploading documents![]()
![]()
![]()
A)There is
A)There is

