Select the graph below that best represents each description and fill in any blanks. 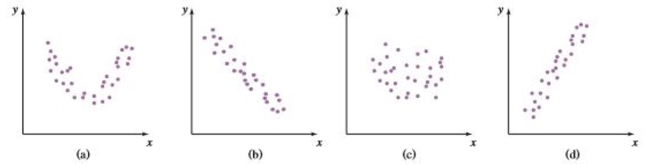 A positive linear relationship exists when the points fall approximately in an
ascending straight line from left to right. In this case as the x values are increasing,
the y values are ________. This relationship is best illustrated by graph ________.
Correct Answer:
Verified
Q117: Find the area under the normal distribution
Q118: Normal distributions are very commonly used for
Q119: Suppose that the mean sale price for
Q120: According to recent research, the mean height
Q121: Draw a scatter plot and describe the
Q123: Based on data compiled by the World
Q124: Draw a scatter plot for the data
Q125: Draw a scatter plot and describe the
Q126: The average amount customers at a certain
Q127: Find the area under the normal distribution
Unlock this Answer For Free Now!
View this answer and more for free by performing one of the following actions

Scan the QR code to install the App and get 2 free unlocks

Unlock quizzes for free by uploading documents