Find the range, variance, and standard deviation for the given data. The table below shows the
Average points scored per game by several intramural softball teams. Round to one decimal place. 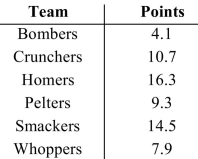
A) range: 10.2, variance: 16.5, standard deviation: 4.1
B) range: 12.2, variance: 16.5, standard deviation: 4.1
C) range: 12.2, variance: 19.8, standard deviation: 4.4
D) range: 10.2, variance: 19.8, standard deviation: 4.4
Correct Answer:
Verified
Q89: A university finished the season ranked fourth
Q90: If a student's rank in a class
Q91: Fran's percentile rank on an exam in
Q92: The table shows the number of class
Q93: For the 8 test scores shown, which
Q95: Use the box plot to fill in
Q96: Suppose that you find the mean weight
Unlock this Answer For Free Now!
View this answer and more for free by performing one of the following actions

Scan the QR code to install the App and get 2 free unlocks

Unlock quizzes for free by uploading documents