Fifty 10-year-olds were monitored to determine the number of hours per week they spent watching
television, surfing the net, and playing video games. The results were used to obtain the frequency
distribution below. Construct a histogram and frequency polygon for the data. 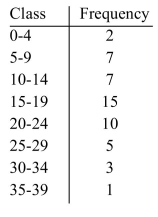
Correct Answer:
Verified
Q17: A recent study showed that eating garlic
Q18: To study the number of credit hours
Q19: A researcher numbered all of the colleges
Q20: A researcher numbered all of the colleges
Q21: Construct a stem leaf plot for the
Q23: To obtain the frequency distribution below, twenty-three
Q24: Construct a bar graph for the number
Q25: The exam grades of 31 students were
Q26: Fifty people participated in a poll to
Q27: Fifty families reported their annual household income
Unlock this Answer For Free Now!
View this answer and more for free by performing one of the following actions

Scan the QR code to install the App and get 2 free unlocks

Unlock quizzes for free by uploading documents