The following frequency distribution shows for a certain high school the number of freshmen,
sophomores, juniors, and seniors who smoke. Construct a bar graph for the data. 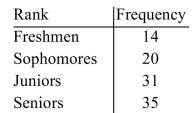
Correct Answer:
Verified
Q27: Fifty families reported their annual household income
Q28: A small company did a poll of
Q29: Construct a stem and leaf plot for
Q30: Fifty people participated in a poll to
Q31: Construct a pie chart for the following
Q33: A small company did a poll of
Q34: The GPAs of 20 students are given
Q35: The following frequency distribution shows for a
Q36: Construct a bar graph for the following
Q37: Construct a pie chart for the number
Unlock this Answer For Free Now!
View this answer and more for free by performing one of the following actions

Scan the QR code to install the App and get 2 free unlocks

Unlock quizzes for free by uploading documents