The graph below displays the median housing prices for all houses sold in Anywhere, US between 2003 and
2008. 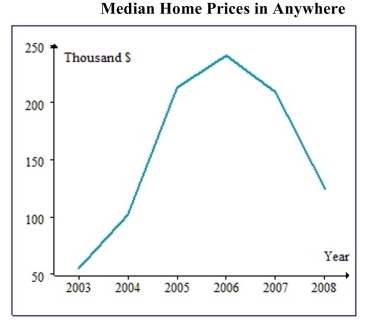 List the set of years in which the median price was above $150,000.
A) (2005, 2006, 2007, 2008}
B) (2003, 2004}
C) (2005, 2006, 2007}
D) (2003, 2004, 2008}
Correct Answer:
Verified
Q12: Which set is finite? Q13: Write the set using the descriptive method: Q14: Classify each pair of sets as equal, Q15: State whether the collection is well-defined or Q16: Find all subsets of the set. {2, Q18: Write the set using set-builder notation: Q19: Classify each pair of sets as equal, Q20: Classify each pair of sets as equal, Q21: Let U = {5, 10, 15, 20, Q22: Draw a Venn diagram and shade the
A) ![]()
{9,
{1, 3,
Unlock this Answer For Free Now!
View this answer and more for free by performing one of the following actions

Scan the QR code to install the App and get 2 free unlocks

Unlock quizzes for free by uploading documents