Use this graph to answer the question. 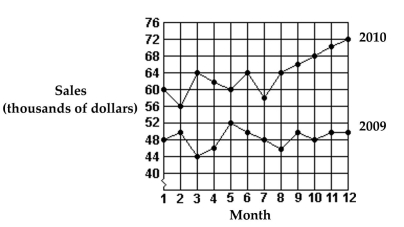
-What were the sales in month 8 of 2010?
A) $50,000
B) $62,000
C) $64,000
D) $66,000
Correct Answer:
Verified
Q32: Find the mean. Round to the nearest
Q33: This frequency table gives the distribution of
Q34: Find the median.
-Monthly net gains: $8,768, $1,824,
Q35: Find the weighted mean. Round to the
Q36: Find the grade point average for the
Q38: Use this graph to answer the question.
Q39: Make a bar graph using the given
Q40: This frequency table gives the distribution of
Q41: Solve the following circle graph problems.
-If total
Q42: Use this graph to answer the question.
Unlock this Answer For Free Now!
View this answer and more for free by performing one of the following actions

Scan the QR code to install the App and get 2 free unlocks

Unlock quizzes for free by uploading documents