Use the REGRESSION feature on a graphing calculator.
-As the number of farms has decreased in South Carolina, the average size of the remaining farms has grown larger, as shown below. 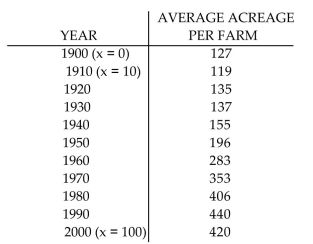 Let x represent the number of years since 1900. Use a graphing calculator to fit a quadratic function to the data. Round
Your answer to five decimal places.
A) 
B) 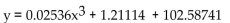
C) 
D) 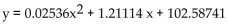
Correct Answer:
Verified
Q120: Solve the equation graphically to four decimal
Q121: The graph that follows is the graph
Q122: Use the REGRESSION feature on a graphing
Q123: The graph that follows is the graph
Q124: Solve the problem. Q126: Use the REGRESSION feature on a graphing Q127: Solve the problem. Q128: Solve the problem. Q129: Solve the problem. Q130: The graph that follows is the graph
-![]()
-The financial department of a
-![]()
-Suppose the sales of a
Unlock this Answer For Free Now!
View this answer and more for free by performing one of the following actions

Scan the QR code to install the App and get 2 free unlocks

Unlock quizzes for free by uploading documents