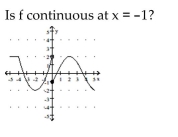
The graph of y = f(x) is shown. Use the graph to answer the question.
-
A) No
B) Yes
Correct Answer:
Verified
Q48: Find average rate of change for the
Q49: Provide an appropriate response.
-Use a graphing utility
Q50: Provide an appropriate response.
-Determine where the function
Q51: Provide an appropriate response.
-Solve the inequality and
Q52: The graph of y = f(x) is
Q54: The graph of y = f(x) is
Q55: Provide an appropriate response.
-Determine where the function
Q56: Find average rate of change for the
Q57: Provide an appropriate response.
-Use a sign chart
Q58: Provide an appropriate response.
-Use a graphing utility
Unlock this Answer For Free Now!
View this answer and more for free by performing one of the following actions

Scan the QR code to install the App and get 2 free unlocks

Unlock quizzes for free by uploading documents