Solve the problem.
-Over the years, State University has seen an increase in the number of students majoring in Native American Studies. The graph below shows the number of
Students with this major for the past several years. Does the graph display a linear relationship? 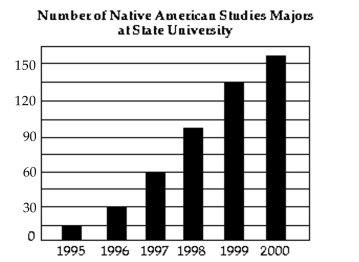
A) Yes
B) No
Correct Answer:
Verified
Q37: Graph by plotting points. Plot at least
Q38: Determine which of the four ordered pairs
Q39: Determine which of the four ordered pairs
Q40: Graph by plotting points. Plot at least
Q41: Graph using the x- and y-intercepts.
-
Q43: Graph by plotting points. Plot at least
Q44: Graph by plotting points. Plot at least
Q45: Graph using the x- and y-intercepts.
-
Q46: Graph by plotting points. Plot at least
Q47: Graph by plotting points. Plot at least
Unlock this Answer For Free Now!
View this answer and more for free by performing one of the following actions

Scan the QR code to install the App and get 2 free unlocks

Unlock quizzes for free by uploading documents