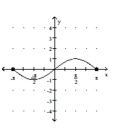
Determine whether the graph illustrated represents a function. Give the domain and range of the relation or function.
-
A) 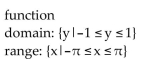
B) 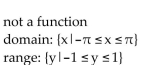
C) 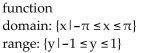
D) 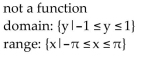
Correct Answer:
Verified
Q52: Evaluate the function for the indicated value.
-
Q53: Solve the problem.
-The formula for the circumference
Q54: Solve the problem.
-The formula for changing Celsius
Q55: Determine whether the graph illustrated represents a
Q56: Solve the problem.
-The formula for the area
Q58: Evaluate the function for the indicated value.
-
Q59: The graph below shows the percentage of
Q60: Determine whether the graph illustrated represents a
Q61: The graph below shows the percentage of
Q62: Graph the linear function by plotting the
Unlock this Answer For Free Now!
View this answer and more for free by performing one of the following actions

Scan the QR code to install the App and get 2 free unlocks

Unlock quizzes for free by uploading documents