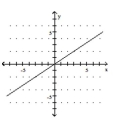
Determine whether the graph illustrated represents a function. Give the domain and range of the relation or function.
-
A) 
B) 
C) 
D) 
Correct Answer:
Verified
Q39: Determine if the relation illustrated is a
Q40: Provide an appropriate response.
-The set of of
Q41: Evaluate the function for the indicated value.
-f(x)
Q42: Evaluate the function for the indicated value.
-
Q43: Solve the problem.
-The formula for the volume
Q45: Evaluate the function for the indicated value.
-
Q46: Determine if the relation illustrated is a
Q48: Determine if the relation illustrated is a
Q49: Determine whether the graph illustrated represents a
Q58: The graph below shows the percentage of
Unlock this Answer For Free Now!
View this answer and more for free by performing one of the following actions

Scan the QR code to install the App and get 2 free unlocks

Unlock quizzes for free by uploading documents