Multiple Choice
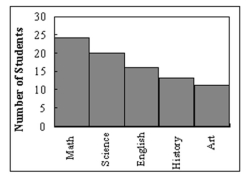 What type of graph is the figure below?
A) Pareto chart
B) pictograph
C) ogive
D) pie graph
Correct Answer:
Verified
Related Questions
Q22: Which type of graph represents the data
Q49: A time series graph is useful for
Q52: A Pareto chart does not have which
Q53: The graphs that have their distributions as
Q54: The total frequency of the data whose
Q56: Which of the following is a histogram?
Q60: Which of the following is a Pareto
Unlock this Answer For Free Now!
View this answer and more for free by performing one of the following actions

Scan the QR code to install the App and get 2 free unlocks

Unlock quizzes for free by uploading documents