True/False
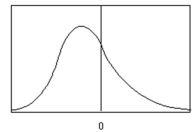 The figure below is an example of a negatively skewed distribution.
Correct Answer:
Verified
Related Questions
Q1: The following formula can be used to
Q3: The z value corresponding to 48.81% of
Q5: Which of the following properties does not
Q6: On an easy test, the mean score
Q8: The area under the curve is always
Q9: The z value that corresponds to the
Q9: In applied statistics, the area under the
Q10: The total area under the normal distribution
Q12: The area under the normal distribution curve
Q20: A random sample of size 4 is
Unlock this Answer For Free Now!
View this answer and more for free by performing one of the following actions

Scan the QR code to install the App and get 2 free unlocks

Unlock quizzes for free by uploading documents