Use the REGRESSION feature on a graphing calculator.
-For some reason the quality of production decreased as the year progressed at a flash drive manufacturing plant. The following data represent the percentage of defective flash drives produced at the plant in the
Corresponding month of the year. 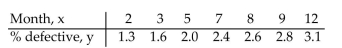 Use the regression equation with values rounded to four decimals to predict the percentage of defective drives in month
6, June.
A) 2.0%
B) 2.20%
C) 2.3%
D) 2.15%
Correct Answer:
Verified
Q57: Provide an appropriate response.
-Use the graph to
Q58: Solve the problem.
-The cost of manufacturing a
Q59: Provide an appropriate response.
-Write the equation of
Q60: Solve the problem.
-A small company that makes
Q61: Use the REGRESSION feature on a graphing
Q63: Use the REGRESSION feature on a graphing
Q64: Use the graph to find the average
Q65: Use the REGRESSION feature on a graphing
Q66: Provide an appropriate response.
-Given two points s
Q67: Use the REGRESSION feature on a graphing
Unlock this Answer For Free Now!
View this answer and more for free by performing one of the following actions

Scan the QR code to install the App and get 2 free unlocks

Unlock quizzes for free by uploading documents