Provide an appropriate response.
-The graph below is an ogive of scores on a math test. 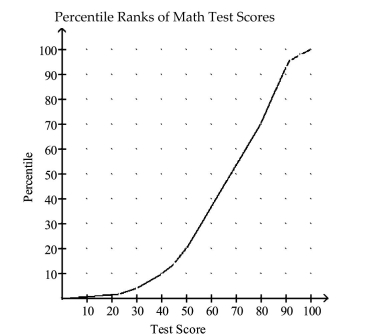 Use the graph to approximate the test score that corresponds to the 10th percentile?
A) 40
B) 1
C) 34
D) 6
Correct Answer:
Verified
Q153: Provide an appropriate response.
-The cholesterol levels
Q154: Provide an appropriate response.
-The test scores
Q155: Provide an appropriate response.
-The cholesterol levels
Q156: Provide an appropriate response.
-Use the data
Q157: Provide an appropriate response.
-The birth weights for
Q159: Provide an appropriate response.
-The test scores
Q160: Provide an appropriate response.
-Many firms use on-the-job
Q161: Provide an appropriate response.
-A teacher gives
Q162: Provide an appropriate response.
-The cholesterol levels
Q163: Provide an appropriate response.
-The weights (in
Unlock this Answer For Free Now!
View this answer and more for free by performing one of the following actions

Scan the QR code to install the App and get 2 free unlocks

Unlock quizzes for free by uploading documents