The graph depicts IQ scores of adults, and those scores are normally distributed with a mean of 100 and a standard deviation of 15. Find the probability that a member selected at random is from the shaded area of the
Graph. 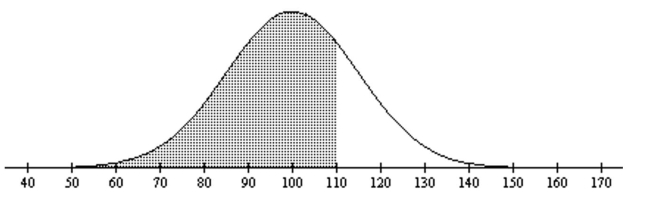
A) 0.7486
B) 0.4400
C) 0.6293
D) 0.8051
Correct Answer:
Verified
Q55: Assume that the heights of American men
Q56: An airline knows from experience that
Q57: Assume that blood pressure readings are
Q58: IQ test scores are normally distributed with
Q59: IQ test scores are normally distributed with
Q61: Find the z-score for which 99% of
Q62: Find the z-score that has 84.85% of
Q63: Use a standard normal table to
Q64: Provide an appropriate response. Use the Standard
Q65: For the standard normal curve, find
Unlock this Answer For Free Now!
View this answer and more for free by performing one of the following actions

Scan the QR code to install the App and get 2 free unlocks

Unlock quizzes for free by uploading documents