The graph below shows the percentage of students enrolled in the College of Engineering at State University. Use the
graph to answer the question. 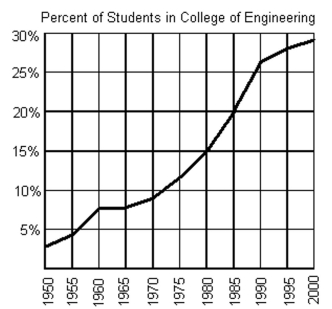
-If f(x) = 9%, what year is represented by x?
A) 1975
B) 1960
C) 1965
D) 1970
Correct Answer:
Verified
Q193: Use the vertical line test to determine
Q194: Decide whether the relation defines a function.
-{(-4,
Q195: Find the domain and range.
-{(11,-4), (-3,5), (3,7),
Q196: Find the domain and range.
-{(3,4), (-8,-6), (9,3),
Q197: Use the vertical line test to determine
Q199: Use the vertical line test to determine
Q200: Decide whether the relation defines a function.
-{(1,
Q201: Evaluate the function.
-Find h(2)whenhen h(
Q202: Use the graph to find the indicated
Q203: Determine whether the ordered pairs given are
Unlock this Answer For Free Now!
View this answer and more for free by performing one of the following actions

Scan the QR code to install the App and get 2 free unlocks

Unlock quizzes for free by uploading documents