The bar graph shows the number of students who flunk Dr. Jones' class each year. 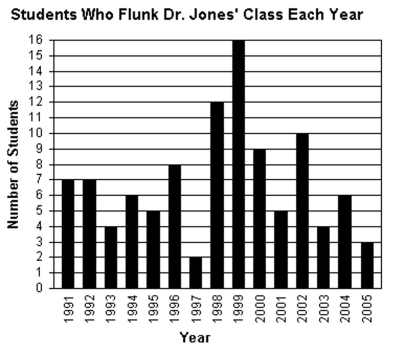
-During which year(s) did exactly 4 students flunk Dr. Jones' class?
A) 2003
B) 1993
C) 1993, 2003
D) 1993, 2001
Correct Answer:
Verified
Q105: The pictograph shows the number of bicycles
Q106: The line graph shows the recorded hourly
Q107: The line graph shows the recorded hourly
Q108: The bar graph shows the number of
Q109: Fill in the blank with one
Q111: Fill in the blank with one
Q112: Use the information given to draw
Q113: The line graph shows the recorded hourly
Q114: The pictograph shows the number of bicycles
Q115: Fill in the blank with one
Unlock this Answer For Free Now!
View this answer and more for free by performing one of the following actions

Scan the QR code to install the App and get 2 free unlocks

Unlock quizzes for free by uploading documents