The circle graph shows the results of the student council presidential election. The complete circular area represents 100%
of the votes.
-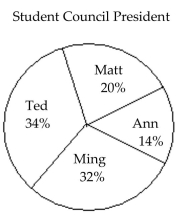 300 total votes The circle graph shows what percent of the vote each person received.How many votes did Ted get?
A) 60
B) 42
C) 96
D) 102
Correct Answer:
Verified
Q28: The list shows the scores for
Q29: The histogram shows the scores of each
Q30: Twenty teenagers were asked to give
Q31: The circle graph shows the results
Q32: The histogram shows the scores of
Q34: The circle graph shows the results
Q35: The double-line graph shows temperature highs and
Q37: The line graph shows the recorded hourly
Q38: The line graph shows the recorded hourly
Q193: Use the graph to solve the problem.
-During
Unlock this Answer For Free Now!
View this answer and more for free by performing one of the following actions

Scan the QR code to install the App and get 2 free unlocks

Unlock quizzes for free by uploading documents