The double-line graph shows temperature highs and lows for a week. 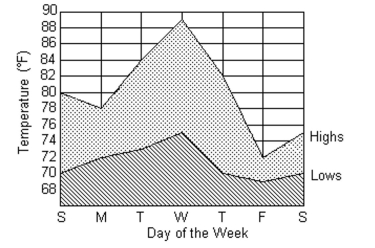
-On what day of the week was the difference between the high temperature and the low temperature the least? What was this difference in temperature?
Correct Answer:
Verified
Q34: The circle graph shows the results
Q35: The double-line graph shows temperature highs and
Q37: The line graph shows the recorded hourly
Q38: The line graph shows the recorded hourly
Q40: The circle graph shows the results of
Q41: Fill in the table. Round to
Q42: Find the mean. If necessary, round to
Q43: The circle graph summarizes the results
Q44: Find the mean. If necessary, round to
Q193: Use the graph to solve the problem.
-During
Unlock this Answer For Free Now!
View this answer and more for free by performing one of the following actions

Scan the QR code to install the App and get 2 free unlocks

Unlock quizzes for free by uploading documents