The bar graph shows the number of tickets sold each week by the garden club for their annual flower show. 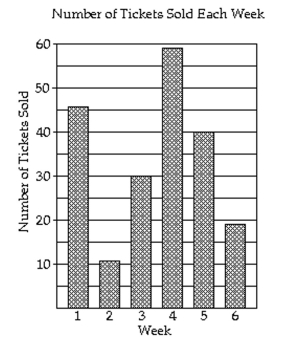
-How many tickets were sold in all?
A) 205 tickets
B) 215 tickets
C) 105 tickets
D) 195 tickets
Correct Answer:
Verified
Q1: The bar graph shows the expenditures of
Q2: The following pictograph shows the number of
Q3: The bar graph shows the number of
Q5: Use the information given to draw
Q6: The following pictograph shows the number of
Q7: The following pictograph shows the number of
Q8: The following pictograph shows the number of
Q9: The bar graph shows the expenditures of
Q10: The bar graph shows the number of
Q11: The following pictograph shows the number of
Unlock this Answer For Free Now!
View this answer and more for free by performing one of the following actions

Scan the QR code to install the App and get 2 free unlocks

Unlock quizzes for free by uploading documents