The following pictograph shows the number of bicyclists who participated in the Labor Day weekend bicycle race for the
years 2003-2009. Use the graph to answer the question. 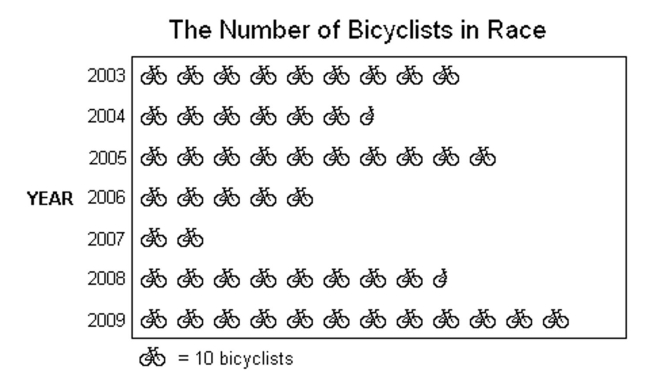
-In what years was there a decline in the number of cyclists who participated in the race?
A) 2004, 2006
B) 2004, 2006, 2007
C) 2004, 2006, 2007, 2008
D) 2005, 2008, 2009
Correct Answer:
Verified
Q12: The bar graph shows the expenditures of
Q13: The histogram shows the scores of each
Q14: The following pictograph shows the number of
Q15: The bar graph shows the number of
Q16: The bar graph shows the number of
Q18: The bar graph shows the number of
Q19: The following pictograph shows the number of
Q20: Use the information given to draw
Q21: The histogram shows the scores of each
Q22: The circle graph shows the results of
Unlock this Answer For Free Now!
View this answer and more for free by performing one of the following actions

Scan the QR code to install the App and get 2 free unlocks

Unlock quizzes for free by uploading documents