In the following schematic diagram, which curve (A to D) do you think better shows the qualitative relationship between the affinity of a developing T cell's TCR for self-peptide-MHC complexes in the thymus and the survival chance of the cell? 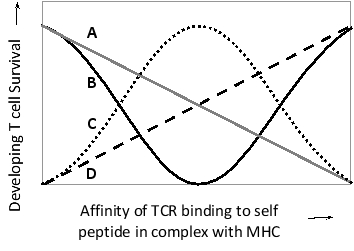
Correct Answer:
Verified
View Answer
Unlock this answer now
Get Access to more Verified Answers free of charge
Q37: Indicate true (T) and false (F) statements
Q38: How many hypervariable loops are there in
Q39: Where are the hypervariable regions located in
Q40: Consider two solution chambers of equal volume
Q41: Indicate whether each of the following cell-surface
Q42: The schematic drawing below summarizes the differentiation
Q43: Sort the following events to reflect the
Q44: Different mice have different allelic variants of
Q46: From an evolutionary perspective, which mating pattern
Q47: A patient with persisting larger-than-normal lymph nodes
Unlock this Answer For Free Now!
View this answer and more for free by performing one of the following actions

Scan the QR code to install the App and get 2 free unlocks

Unlock quizzes for free by uploading documents