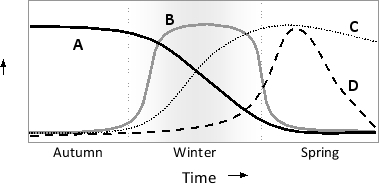
The qualitative graph below shows the molecular changes accompanying vernalization in the flowering plant Arabidopsis thaliana. Indicate which curve (A to D) in the graph better represents the temporal changes in each of the following variables. Your answer would be a four-letter string composed of letters A to D only, with each letter used once, e.g. BACD.
( ) Level of Coolair noncoding RNA
( ) Level of Flowering locus C (FlC) gene product (transcriptional repressor)
( ) Level of Flowering locus T (Ft) gene product (transcriptional activator)
( ) Level of repressive chromatin marks at the FlC locus
Correct Answer:
Verified
As Coolair levels (curve B) peak durin...
View Answer
Unlock this answer now
Get Access to more Verified Answers free of charge
Q20: Sort the following primary axes in the
Q21: Does the nuclear-to-cytoplasmic ratio increase (I) or
Q22: Stromal cell-derived factor 1 (SDF1) is a
Q23: During branching morphogenesis in lung development, …
A)
Q24: The Steel factor/Kit signaling pathway plays an
Q26: Which of the following evolutionary changes better
Q27: The gene encoding Hes7 in mouse contains
Q28: Which of the following is NOT true
Q29: The role of Chordin and Noggin in
Q30: Fill in the blank in the following
Unlock this Answer For Free Now!
View this answer and more for free by performing one of the following actions

Scan the QR code to install the App and get 2 free unlocks

Unlock quizzes for free by uploading documents