The following graph qualitatively represents the gradients of Nodal and Lefty gene products in an early frog embryo. The position along which primary axis is defined by these gradients? Which curves correspond to these two proteins? 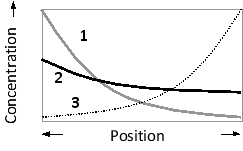
A) D-V axis; curves 1 and 2
B) D-V axis; curves 1 and 3
C) A-V axis; curves 1 and 2
D) A-V axis; curves 1 and 3
Correct Answer:
Verified
Q28: Which of the following is NOT true
Q29: The role of Chordin and Noggin in
Q30: Fill in the blank in the following
Q31: Which of the following is NOT true
Q32: Cactus is a maternal-effect gene coding for
Q34: Indicate true (T) and false (F) statements
Q35: The following schematic drawings show an epithelial
Q36: TSH is a pituitary hormone that stimulates
Q37: In classical experiments done half a century
Q38: Assuming that the only function of Short
Unlock this Answer For Free Now!
View this answer and more for free by performing one of the following actions

Scan the QR code to install the App and get 2 free unlocks

Unlock quizzes for free by uploading documents