Which of the following simplified diagrams better shows the changes in the concentrations of three major cyclin-Cdk complexes (G?/S-Cdk, S-Cdk, and M-Cdk) in the cell in different stages of the cell cycle? 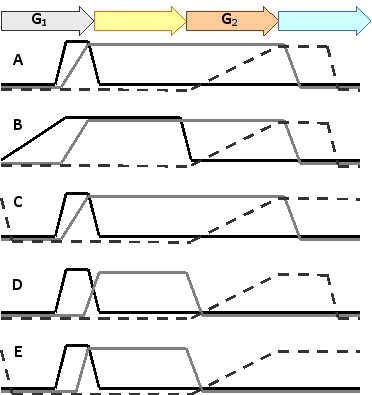
Correct Answer:
Verified
View Answer
Unlock this answer now
Get Access to more Verified Answers free of charge
Q9: Which one of the following chromosomes has
Q10: Resveratrol is a natural compound found in
Q11: The cell cycle can be arrested in
Q12: Which of the following is more directly
Q13: Mammalian Cdk inhibitor proteins (CKIs) can be
Q15: Indicate whether each of the following occurs
Q16: Fill in the blank: "The … is
Q17: Sort the following schematic diagrams (A
Q18: You have been studying the effect of
Q19: Indicate true (T) and false (F) statements
Unlock this Answer For Free Now!
View this answer and more for free by performing one of the following actions

Scan the QR code to install the App and get 2 free unlocks

Unlock quizzes for free by uploading documents