Multiple Choice
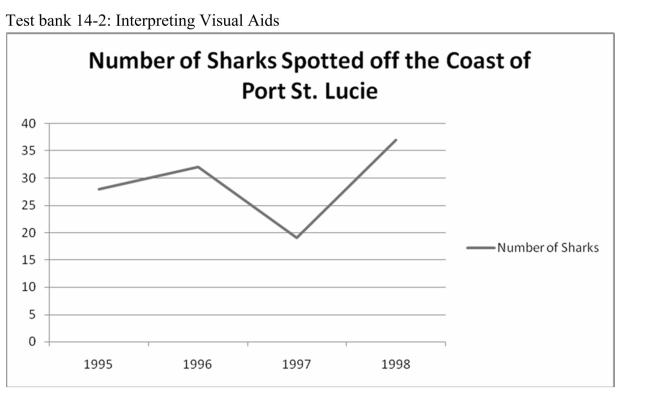
-The line graph above shows
A) a steady increase in the number of sharks.
B) a steady decrease in the number of sharks.
C) a sharp downturn in the numbers of sharks followed by an increase.
D) a fluctuation in the number of sharks.
Correct Answer:
Verified
Related Questions

