Suppose that a typical household in the United States has an average after-tax income of $38,450. The circle graph below represents how this annual income is spent. (Note: It is because of rounding that the percents do not add up to 100 .) How much more is spent on food than on entertainment? 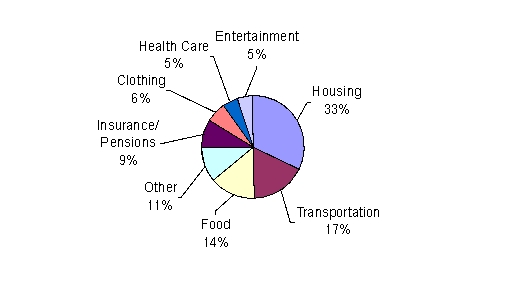
A) $34.61
B) $3460.50
C) $3360.50
D) $346.05
E) $3560.50
Correct Answer:
Verified
Q4: Suppose that a typical household in the
Q5: An accounting major recorded the number
Q6: A nursing student at a community college
Q7: The circle graph shows a breakdown,
Q8: The circle graph shows the budget allocation
Q10: There are approximately 300,000,000 people living in
Q11: The circle graph shows the budget
Q12: The pictograph below shows the approximate
Q13: The circle graph shows the number
Q14: The circle graph shows the number
Unlock this Answer For Free Now!
View this answer and more for free by performing one of the following actions

Scan the QR code to install the App and get 2 free unlocks

Unlock quizzes for free by uploading documents