The figure given below shows the aggregate expenditures function of an economy.
Figure 9.5
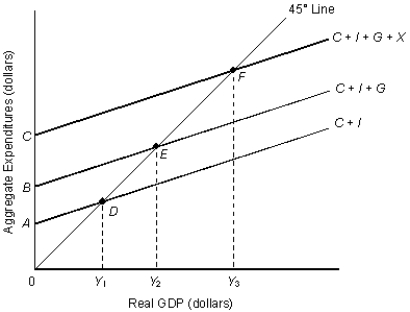
-Refer to Figure 9.5. The amount of government spending is indicated by the distance _____.
A) Y1Y2
B) DE
C) Y2Y3
D) BC
E) AB
Correct Answer:
Verified
Q64: In most derivations of the aggregate expenditures
Q87: Changes in autonomous consumption will affect the
Q90: Consumption, saving, and wealth all represent stock
Q95: In the table given below Y
Q95: The slope of the aggregate expenditures function
Q97: The figure given below shows the aggregate
Q99: Suppose that the consumption function crosses the
Q101: Other things equal, a marginal propensity to
Q107: Suppose that the U.S.trade balance is positive.Hence,
Q115: Suppose the Kwik Print Company considers an
Unlock this Answer For Free Now!
View this answer and more for free by performing one of the following actions

Scan the QR code to install the App and get 2 free unlocks

Unlock quizzes for free by uploading documents