The figure given below represents the consumption function of a country.
Figure 9.3
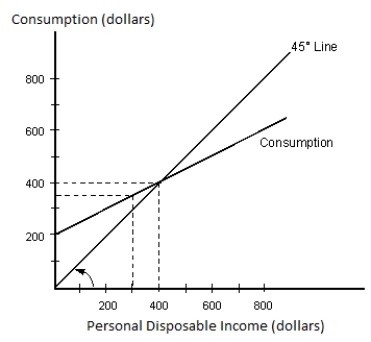
-Refer to Figure 9.3. The savings function of the country will have a positive intercept at all income levels of _____.
A) less than $200
B) greater than $200
C) less than $600
D) greater than $400
E) less than $800
Correct Answer:
Verified
Q23: Suppose total disposable income in Country X
Q27: As disposable income rises:
A)consumption falls as a
Q29: The figure given below represents the consumption
Q29: If a household's disposable income increases from
Q30: The figure given below represents the consumption
Q32: The sum of the MPC and the
Q33: The table given below reports the
Q34: The figure given below shows the consumption
Q35: The figure given below represents the consumption
Q36: The figure given below shows the consumption
Unlock this Answer For Free Now!
View this answer and more for free by performing one of the following actions

Scan the QR code to install the App and get 2 free unlocks

Unlock quizzes for free by uploading documents