Multiple Choice
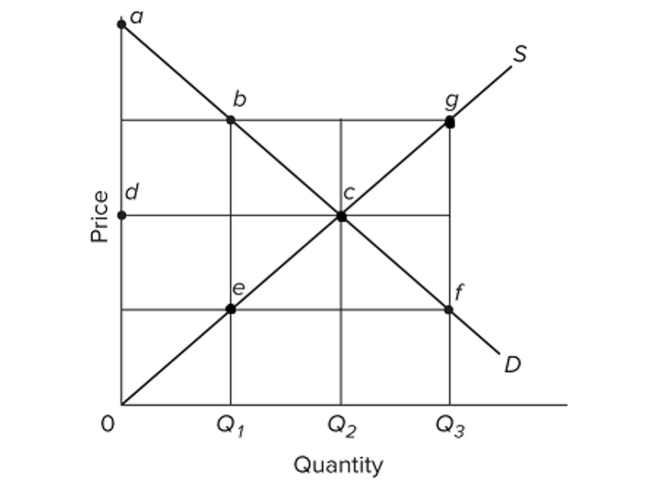 Refer to the provided graph of a competitive market. If the output level increases from Q2 to Q3, then the
A) marginal cost of the product becomes closer to its marginal benefit.
B) marginal cost of the product increases, while its marginal benefit decreases.
C) marginal cost of the product decreases, while its marginal benefit increases.
D) marginal cost of the product stays constant, while its marginal benefit increases.
Correct Answer:
Verified
Related Questions
Q101: When a competitive market achieves allocative efficiency,

