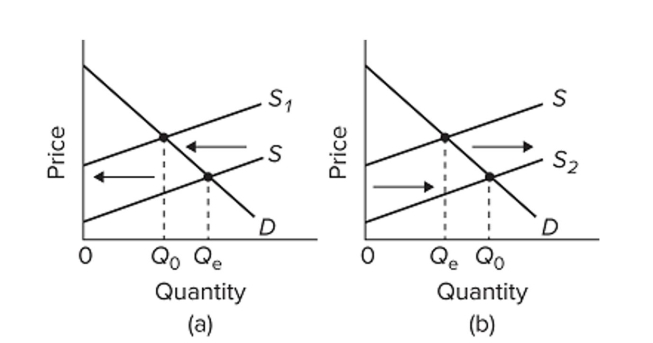
 Refer to the diagrams for two separate product markets. Assume that society's optimal level of output in each market is Q0 and that government purposely shifts the market supply curve from S to
S1 in diagram (a) on the left and from S to S2 in diagram (b) on the right. The shift of the supply curve
From S to S2 in diagram (b) might be caused by a per-unit
A) subsidy paid to the producers of this product.
B) tax on the producers of this product.
C) subsidy paid to the buyers of this product.
D) tax on the buyers of this product.
Correct Answer:
Verified
Q19: Q20: Q21: An efficiency loss (or deadweight loss) Q22: At the output where the combined amounts Q23: A positive externality or spillover benefit occurs Q25: Which of the following conditions does not Unlock this Answer For Free Now! View this answer and more for free by performing one of the following actions Scan the QR code to install the App and get 2 free unlocks Unlock quizzes for free by uploading documents![]()
![]()
A) is

