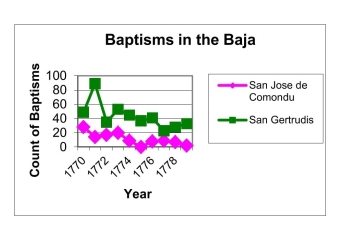
Information about the Spanish missions of Baja California exist in the form of baptisms and burial records. These records provide an opportunity to study Native American populations under Spanish influence. The graph at right displays two time series of the numbers of baptisms at two Central Baja missions, San Jose de Comondu and San Gertrudis. 
In a short paragraph describe and compare the trends in the number of baptisms for
the two missions in this time period, noting any interesting features apparent in the
plots.
Correct Answer:
Verified
View Answer
Unlock this answer now
Get Access to more Verified Answers free of charge
Q6: In a scatter plot, both the horizontal
Q7: Knowledge of where animals forage for
Q8: Hoofed animals such as cattle and
Q8: An outlier is a data value that
Q8: If the upper tail of a distribution
Q9: A univariate data set must contain numerical,
Q10: A time series plot is a graph
Q15: A segmented bar chart uses rectangles rather
Q16: The Des Moines Register article in problem
Q18: A unimodal set of data is one
Unlock this Answer For Free Now!
View this answer and more for free by performing one of the following actions

Scan the QR code to install the App and get 2 free unlocks

Unlock quizzes for free by uploading documents