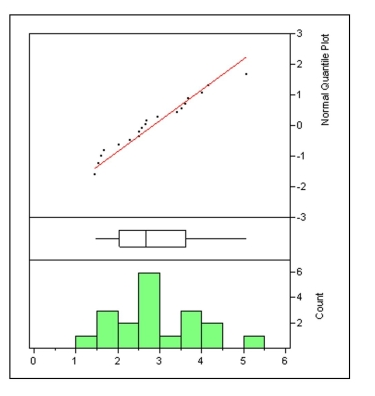
The Economist is a weekly newspaper that focuses on international politics, business news, and opinion. Each year the "Big Mac Index," the price ($ U. S.) of a Big Mac in countries around the world, is published as a light-hearted way of comparing currencies. Displayed at right are 3 views of the BMIs in mid-summer, 2007: the normal probability plot, a box and whisker plot, and a histogram. Using one of the three plots, discuss any indication of skew you see. In your discussion be specific about what aspect(s) of the graph you feel is/are indicative of skew.
Correct Answer:

Verified
The plots seem to exhibit a slight skew....
View Answer
Unlock this answer now
Get Access to more Verified Answers free of charge

